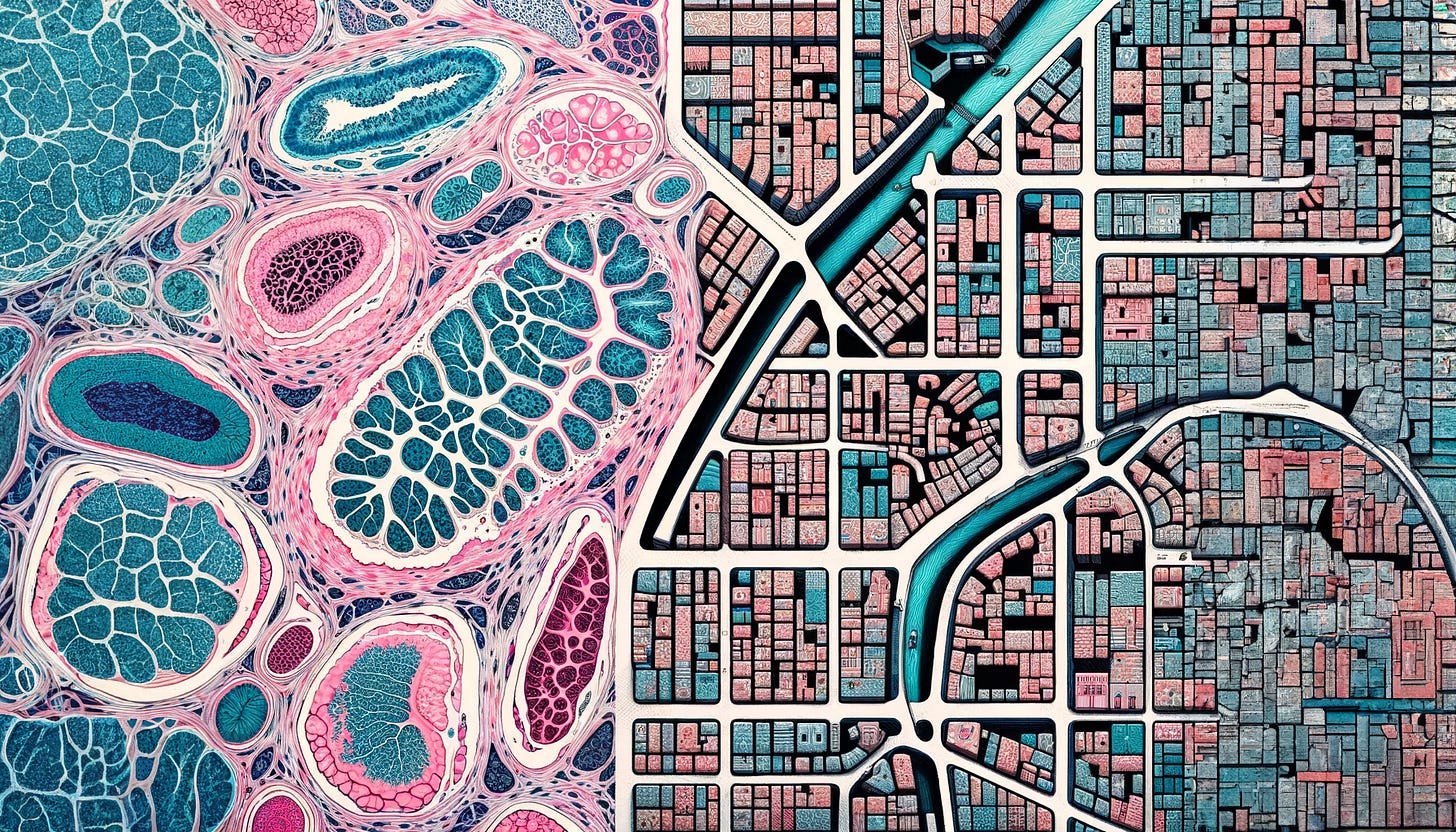
The best metaphor for spatial transcriptomics
How everyone can understand what is spatial transcriptomics
In our bodies, cells do not function in isolation but they are parts of a complex, evolving ecosystem. When I was a kid, the animated series “Once Upon a Time… Life” was popular among children of my age. It represented entities within our bodies – like cells, antibodies, bacteria, and viruses – as interdependent members of a society. Cells would interact by competing and cooperating.
Scientifically, capturing these interactions from biological experiments on a large scale has always been difficult. Now, a new technology called “spatial transcriptomics” allows us to do that through an important aspect: cells need to be close to each other to interact. If two cells are far apart, it is unlikely that molecules from one will reach the other.
But how does spatial transcriptomics measure the proximity of cells to figure out how they interact?
To understand this, in this post we will explore the evolution of this technology. People in the field have used many metaphors to explain the transition from non-spatial to spatial technologies. Over time, I realized that one specific metaphor is particularly accurate, but I have never seen it described explicitly.
The society of cells
Imagine being the mayor of a city. A city is composed by various types of buildings, such as residential buildings, commercial buildings, banks... Every building is inhabited by different types of people. For example, commercial buildings may have chefs, waiters, and cashiers, while banks might be filled with office workers and managers.
Similarly, an organ is composed of different types of cells, such as tumor cells, immune cells, neurons... Every type of cell is characterized by the activity of different genes. The activity of certain genes results in the production of associated proteins, which, just like people, are the molecules that carry out tasks (structure, storage, metabolism) and that are used to communicate between cells.
To summarize, in this metaphor:
organ = city
cell = building
gene/protein = person
In this society, your goal as the mayor is to understand the city's health, predict its evolution, and find ways to improve it.
Bulk RNA sequencing: the city-wide overview
Since 15-20 years ago, as a mayor, the only information you could access was a general view of the city. You received a broad, averaged-out picture of the city's characteristics, like surface area, number of inhabitants, average income, unemployment rate, and crime rate.
This mirrors the technology called bulk RNA sequencing. Here, you get a measurement of activity for each gene, but it’s an average over all the cells in the sample, much like aggregated statistics of a city can hide the unique features of every building.
This can already provide a lot of information, but it is certainly not enough.
Single-cell RNA sequencing: the building list
Realizing that this broad view isn't enough to make effective policies, you decide to inspect individual buildings. You send out teams to visit each building, count the number of people, understand what they are doing, and how they interact within that building. This way, you get detailed information about each building's function and the activities within it.
You can see whether a city has a healthy proportion of buildings, with the right balance of residential buildings, and commercial ones. If 80% of the buildings are Starbucks, probably the city doesn’t have a promising future.
This is equivalent to single-cell RNA sequencing, developed 10-15 years ago, where the gene activity is measured for each cell individually. By analyzing individual cells, you can identify specific cell types, their functions, and their gene expression profiles. You understand the diversity and complexity of people and their jobs (proteins) within each building (cell).
Spatial transcriptomics: building the map
While inspecting individual buildings has given you a lot of detailed information, you now realize that the context and interactions between buildings are crucial. Two cities composed by the same proportion of residential and commercial buildings can look very different. One city could be more US-style, divided into residential areas, without a single shop nearby, and commercial areas, where no people live. The other one could be composed of a European-style mix of residential and commercial buildings.
You decide to hire a team of cartographers to map the entire city, detailing not only the function of each building but also their exact locations and interactions with each other.
This is equivalent to spatial transcriptomics, developed around 5-8 years ago, which allows you to build a map of the city. You can understand not only the function of individual cells but also how they are arranged. You can now explore the connections between buildings (i.e., cell-cell communication) and identify neighborhoods (i.e., spatial domains).
A snapshot in time
An important limitation of spatial transcriptomics is its equivalence to capturing a city's map at a single point in time. The process can only be done once, because the cells in a tissue sample die once extracted from a patient, preventing any observation of how the cells might have evolved. This means that we have spatial information, but we cannot observe its temporal evolution. Spatiotemporal data are still a distant dream, though a few pioneering efforts are bringing us closer to this reality, which I will explore in future posts.
Despite this limitation, the unexplored areas of biology now accessible through spatial transcriptomics are surely going to keep us busy until the next technological breakthrough.
I have also been guilty of using many metaphors to describe spatial transcriptomics. If you want to have another point of view, last year I made a YouTube video describing spatial transcriptomics as a fruit pie.


Bravo!! Indeed an incredibly clever metaphor, and kudos for the beautiful animations (how did you make them? :P)